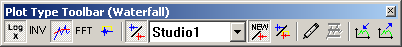
Note that if two plots are displayed, normally the selections will affect only the active plot. An exception is the selections involving the global Plot->Plot Type Settings->General Frequency Domain . These settings will affect all the frequency domain plot types.
 Logarithmic or
linear x-axis. Same as
Logarithmic or
linear x-axis. Same as  found in the plot type settings.
 Invert curve. Same as
  in Plot->Plot Type
Settings->General Frequency Domain
in Plot->Plot Type
Settings->General Frequency Domain
 Smooth curve. Same as
  found in the plot type settings.
Click the
found in the plot type settings.
Click the  button to change
the smooth settings.
button to change
the smooth settings.
 Display
general frequency domain settings. For details see Plot->Plot Type
Settings->General Frequency Domain
.
Display
general frequency domain settings. For details see Plot->Plot Type
Settings->General Frequency Domain
.
 Time window settings. Same as
  in Active measurement group in Plot->Plot Type
Settings->General Frequency Domain
.
in Active measurement group in Plot->Plot Type
Settings->General Frequency Domain
.
 Display guidelines on frequency
response. Same as
Display guidelines on frequency
response. Same as  found only
in settings for Frequency Response/Spectrum plot type
found only
in settings for Frequency Response/Spectrum plot type
 Microphone
compensation. Same as
Microphone
compensation. Same as  found
in settings for the Frequency Response/Spectrum plot type
found
in settings for the Frequency Response/Spectrum plot type
 Perform division using reference measurement. Same as
  in Plot->Plot Type
Settings->General Frequency Domain
.
in Plot->Plot Type
Settings->General Frequency Domain
.
 Update reference
measurement on new measurement. Same as
Update reference
measurement on new measurement. Same as  in Plot->Plot Type
Settings->General Frequency Domain
.
in Plot->Plot Type
Settings->General Frequency Domain
.
 Display time window
settings for the reference measurement. Same as
Display time window
settings for the reference measurement. Same as  in Reference measurement
group in Plot->Plot Type
Settings->General Frequency Domain
. Note that is disabled if
in Reference measurement
group in Plot->Plot Type
Settings->General Frequency Domain
. Note that is disabled if  is not checked, because in this
case the reference measurement time window settings are the same as the active
measurement time window settings and can be accessed using the button.
is not checked, because in this
case the reference measurement time window settings are the same as the active
measurement time window settings and can be accessed using the button.
 Waterfall slice
scrolling downwards, used to set the active slice, for reading cursor values
displayed at the Status Bar. The active slice gets a green color. This
button is enabled only if the waterfall layout mode in the waterfall plot type
settings is Separate lines waterfall as shown in the figure below.
Waterfall slice
scrolling downwards, used to set the active slice, for reading cursor values
displayed at the Status Bar. The active slice gets a green color. This
button is enabled only if the waterfall layout mode in the waterfall plot type
settings is Separate lines waterfall as shown in the figure below.
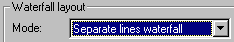
 Waterfall slice
scrolling upwards, used to set the active slice, for reading cursor values
displayed at the Status Bar. The active slice gets a green color. This
button is enabled only if the waterfall layout mode in the waterfall plot type
settings is Separate lines waterfall as shown in the figure
above.
Waterfall slice
scrolling upwards, used to set the active slice, for reading cursor values
displayed at the Status Bar. The active slice gets a green color. This
button is enabled only if the waterfall layout mode in the waterfall plot type
settings is Separate lines waterfall as shown in the figure
above.
 Contents
 Index
Index Search
 Previous
 Next
Next