Contains frequency domain various settings.
If  is
checked, the complex frequency response (after division, if division is
selected) is inverted.
is
checked, the complex frequency response (after division, if division is
selected) is inverted.
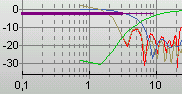
If  is
checked, a vertical line is added to the frequency domain plot types as shown in
the figure below.
is
checked, a vertical line is added to the frequency domain plot types as shown in
the figure below.
The Frequency resolution line will indicate graphically where the data should not be trusted. At the thick part of the line, the results should not at all be trusted. At the thin part of the line (which is twice the size of the thick line), the result is not certain.
The color of the line is set in Plot->Default Curve Styles . The line refers to the active measurement curve.
If  is
checked, a transfer function measurement is
plotted in scope mode. This means that only the
scaling of the input is considered, and not the output scaling. This means again
that if you have calibrated correctly you can display the sound preassure level
of a frequency response plot.
is
checked, a transfer function measurement is
plotted in scope mode. This means that only the
scaling of the input is considered, and not the output scaling. This means again
that if you have calibrated correctly you can display the sound preassure level
of a frequency response plot.
Note that this setting has an effect on the scaling of all plots, not just the frequency domain plots
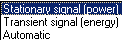
The scope mode setting  has no effect if the measurement
is a transfer function. But if the measurement is performed or set to scope
mode, the choices shown in the figure below are available.
has no effect if the measurement
is a transfer function. But if the measurement is performed or set to scope
mode, the choices shown in the figure below are available.
The settings will affect the scaling of the frequency response. If Stationary signal (power) is selected and the plot type is Frequency Response/Spectrum, the power will be plotted. If the signal is a transient signal, this should not be selected since the level will depend on the window and zero-padding length. To prevent this, select Transient signal (energy).
If you select 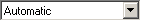 , which is strongly recommended, WinMLS determines the scope mode based
on the measurement settings.
, which is strongly recommended, WinMLS determines the scope mode based
on the measurement settings.
 Contents
 Index
Index Search
 Previous
 Next
Next