
Chart Settings for Active Plot...
Displays the dialog box shown below.
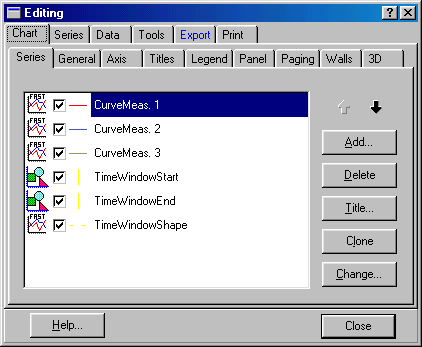
This dialog box gives many possibilities and may seem complicated. Note that it has context-sensitive help functionallity. Click on the question mark button  in the upper right corner, then click on the setting you want to have explained.
The settings of this dialog box are saved to chart files for each plot type and are restored when the plot type is displayed. The chart files are found in the Chart subfolder in the folder where WinMLS is installed.
Note that changes in the plotted curve, e.g. changing colors, will not be saved. Default curve styles are set in Plot->Default Curve Styles....
Now each tab page as shown in the figure below will be described, starting with the Chart page.

