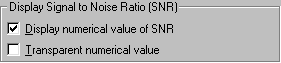
Display Signal to Noise Ratio (SNR)
The signal-to-noise ratio can be displayed in the plot as numbers in the plots as shown in the figure below.
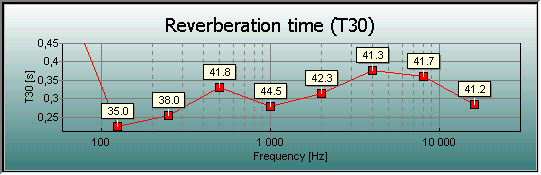
If  is checked, the SNR is added as marks above the plot points as shown in the figure below. If
  is checked, the mark is transparent and not yellow.