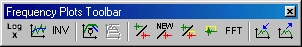
Frequency Plots Toolbar
This toolbar gives quick access to settings useful for all the general frequency domain plot types (magnitude, phase, group delay and waterfall).
Note that if two plots are displayed in a window, the toggles will affect only the active plot. An exception is the toggles involving the global Plot->General Frequency Domain Settings .
 Logarithmic x-axis. Same as
  found in the plot type settings. In case WinMLS is displaying two plots, only the active plot will be refreshed when the button is clicked.
 Smooth curve. Same as
  found in the plot type settings. In case WinMLS is displaying two plots, only the active plot will be refreshed when the button is clicked.
 Invert curve. Same as
  in Plot->General Frequency Domain Settings
 Microphone compensation. Same as
  found in settings for the Frequency Response/Spectrum plot type
 Display guidelines on frequency response. Same as
  found only in settings for Frequency Response/Spectrum plot type
 Perform division using reference measurement. Same as
  in Plot->General Frequency Domain Settings
 Update reference measurement on new measurement. Same as
  in Plot->General Frequency Domain Settings
 Display time window settings for the reference measurement. Same as
  in Reference measurement group in Plot->General Frequency Domain Settings
 Display time window settings for the active measurement. Same as
  in Active measurement group in Plot->General Frequency Domain Settings
 File->General Frequency Domain Settings
 Waterfall slice scrolling downwards, used to set the active slice, for reading cursor values displayed at the Status Bar. The active slice gets a green color. This button is enabled only if the waterfall layout mode in the waterfall plot type settings is Separate lines waterfall as shown in the figure below.
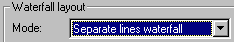
 Waterfall slice scrolling upwards, used to set the active slice, for reading cursor values displayed at the Status Bar. The active slice gets a green color. This button is enabled only if the waterfall layout mode in the waterfall plot type settings is Separate lines waterfall as shown in the figure above.