How to change the curve style (color, type and width)?
The defaults curve style can be changed in Plot->Default Curve Styles . The changes will apply when plotting a new measurement. To update the current curves, select Plot->Refresh All.
If you want to keep the default curve styles but just want to change the curve styles in the current plot, then it can be changed directly from Plot->Chart Settings for Active Plot....
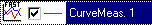
If you want to change the color only, click on the curve to the left of the series title, the red horizontal line shown in the figure below.
(You can do the same thing from the List of Curves toolbar, View->List of Curves Toolbar).
If you want to display the style settings, double-click on the curve title (CurveMeas. 1 shown in the figure above). If the curve type is FastLine, the settings shown below will be displayed.
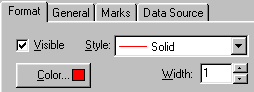
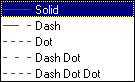
From the Style list the options shown in the figure below can be selected. These are especially useful if plotting several lines and colors are not allowed. Note that if the curve width is larger than 1, the style can only be solid.
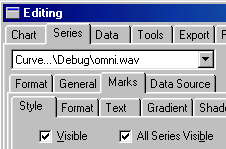
To display the value for each point, marks must be set to visible. This is set from Plot-> Chart Settings for Active Plot... as shown in the figure below. First select the series, then the Marks tab. In the Style tab, make sure Visible is checked.