How to set the time data window when plotting in frequency domain? (determine part of the time data to be used when transforming to the frequency domain)?
The time data window determines the part of the time data to be used when transforming from time domain to the frequency domain. Three ways of setting the time window this will here be described.
•
The time data window settings can be obtained from Plot->General Frequency Domain Settings
, click on the  button found in the upper left part of the dialog box.
If you are performing division, the time window settings for the reference measurement are obtained by clicking the  button found in the lower left part of the dialog box. If you need faster access to these settings, they are found clicking
  and
and  on the Frequency Plots toolbar (View->Frequency Plots Toolbar).
•
If the Time Data Plot type is displayed, the window start and end points can be set directly by clicking and dragging with the mouse. To do this,  must be checked in the time data plot type settings (Plot->Plot Type Settings->Time Data
). Some might find it difficult to do this since the mouse pointer has to be exactly on top of the vertical line that is to be moved. If you find it difficult to use the mouse for doing this, the fast method explained below may be useful.
must be checked in the time data plot type settings (Plot->Plot Type Settings->Time Data
). Some might find it difficult to do this since the mouse pointer has to be exactly on top of the vertical line that is to be moved. If you find it difficult to use the mouse for doing this, the fast method explained below may be useful.
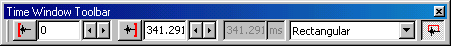
•
Another way of setting the window directly is by using the Time Window toolbar (View->Time Window Toolbar). If a change is made and auto-refresh is on, the plot will be automatically updated with the new settings. After typing a value, click Enter to validate.