How to turn on and modify gridlines
Gridlines can be turned on/off from a button on the standard toolbar. Note that when the Plot->Chart Settings for Active Plot... dialog is opened, the current gridlines are displayed even if they are turned off. Note also that if the plot type is Frequency response/Spectrum, Phase response/Function, Group delay, Waterfall or Levels and if the x-axis is logarithmic, some of the gridline settings are not user changeable.
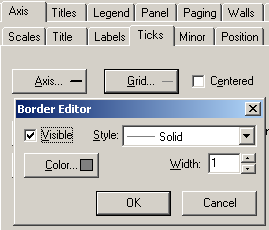
The gridline settings depend on the setup that is used. The gridlines can even be turned off in the setup. To turn on or modify the gridlines; in Plot->Chart Settings for Active Plot... select the Axis tag. Then select the axis from the list (Left Axis or Bottom Axis). Click on the Ticks tag. Finally click on the Grid button and turn on the Visible check box.
Minor gridlines are available from the Minor tag, found at the right side of the Ticks tag.