Plot Toolbar
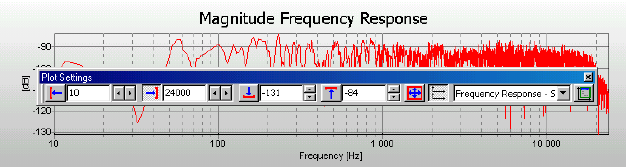
This toolbar should be found very useful. It contains settings for zooming in x- and y-direction, selecting one or two plots, which plot type(s) to be displayed and finally a button for accessing the settings of the active plot type. In the figure below we see a plot with the toolbar on top.
Note that if two plots are plotted in the current window, the settings for the active plot will be displayed in the toolbar. It is a good exercise to click in the other plot to set it active and see how the toolbar settings will change.
 Setting the lower x-axis limit
Setting the upper x-axis limit
Setting the lower y-axis limit
Setting the upper y-axis limit
Auto-scale the plot in all directions