Plot Type Settings: Schroeder Curve
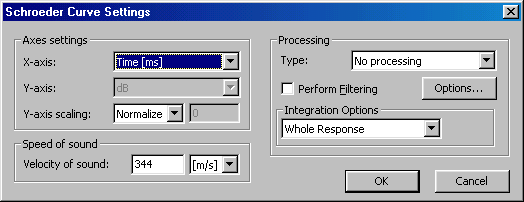
Displays the dialog box shown below.
Most of the Schroeder Curve settings are found and explained in the Plot Type Settings: Time Data
section. But the Schroeder Curve y-axis can only be plotted in dB (the y-axis scaling is set to  which is the most common way to view the Schroeder Curve). The DC-component is automatically removed for the Schroeder curve and it is computed from the last 50% of the measurement data. The Integration Options settings are also unique for this plot type and are explained in the Integration options section of the room acoustics documentation.