Post-processing the measurement
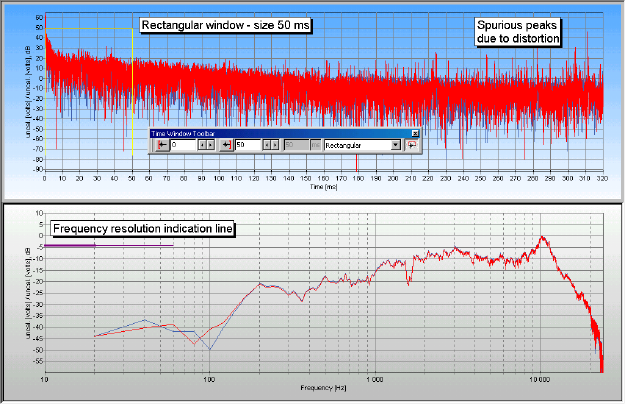
Figure 4 Multimedia microphone and loudspeaker measured on axis at a distance of ~20 cm. Time window 50 ms.
In the upper right part of the figure above, we see that there are several spurious peaks. These are due to distortion in the loudspeaker or microphone, reducing the volume did not reduce the magnitude of these peaks. These peaks do not, however, influence the frequency response shown in the lower part of the plot significantly. Note that a rectangular window is used on the impulse response of length 50 ms displayed in yellow in the figure. The limits can be changed by clicking and dragging, or from the Time Window Toolbar shown in the middle of the figure above.
Decreasing the window size will reduce the noise in the frequency response, but note that it will give a decreased frequency resolution and thus false results for very low frequencies. The Frequency resolution indication line shown in the figure above depends on the window size and is meant to warn the user where the results may not be trusted. At the thick part of the line, the results should not at all be trusted. At the thin part of the line (which is twice the size of the thick line), the result is not certain.
Note that if the frequency resolution is not sufficient, two resonance peaks may not be resolved, but shown as one peak.