Presenting results
Room acoustics parameters can be presented in a text grid, saved to a text file, or plotted directly in a graphics window. The check boxes Display in text grid and Send to text file specifies how to present and/or save results when the calculation is initiated through Room Acoustics->Calculate. All chosen parameters are displayed in the grid or saved to the file.
If the text grid box is checked, a result window will open after the calculation is finished. The data in the grid can be copied to the Windows clipboard for export to spreadsheets or word processing software.
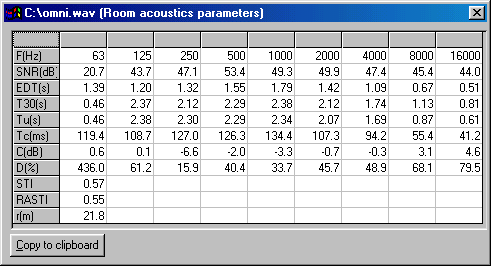
An example of output data is shown below, the contents are:
1.
The name of the primary measurement, or impulse response file
2.
Octave band center frequencies in Hz
3.
SNR in dB, for primary and (optional) secondary input response
4.
Parameters as function of frequency
5.
Parameters independent of frequency
6.
Estimated source to receiver distance in m
(This example incidentally shows a typical anomaly, the combination of a low frequency octave band filter, a short time window, windowing before filtering and a high noise floor creates transient effects that can produce odd looking results, like the 63Hz D(%) value. Calculations are according to recommendations, but the practitioner must use his common sense in interpretation of the data.)
Blank fields indicate calculation errors, which are most often caused by noisy impulse responses and thereby insufficient decay range, or that time ranges are insufficient for a particular parameter. In these cases only particular parameters will be missing.
In some cases all parameters can be missing for a particular frequency band. The most common reason is when truncation of the impulse response at or above the noise floor is chosen in Calculation Options->Integration options, and the truncation point cannot be determined due to too much noise or an odd shape of the response after filtering in this band. See the 6.2.3 section for more information about this situation.
If output to a text file box is chosen, results will be saved to a text file with a similar format as the grid. Saving directly to text file can only be done if the room impulse response itself is saved in a file prior to calculation. The text file ends up having the same name as the impulse response file, with the extension .txt.
For calculations using a secondary impulse response as well, the name of the resulting text file will be composed using both filenames, for instance:
Primary: C:\WinMLS\Debug\Measurements\Studio1.wmb
Secondary: C:\WinMLS\Debug\Measurements\Studio2.wmb
Result: C:\WinMLS\Debug\Measurements\Studio1Studio2.txt
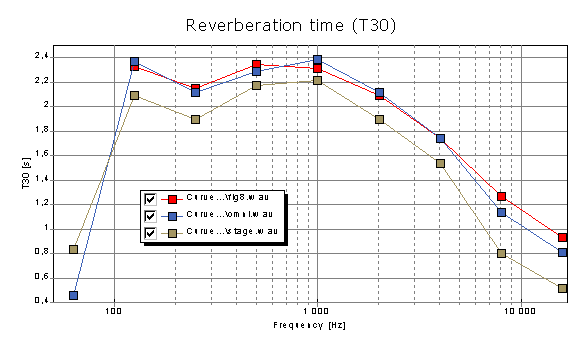
Results can also be plotted directly in a plot window. Only a single parameter at a time can be displayed as function of frequency, but it is possible to plot the same parameter calculated from several impulse responses for easy comparison. Choose the Room Ac. Parameters plot type (can be done from the Plot Toolbar or Plot->Select Plot Type(s) and Active Meas.). The parameter to be plotted is chosen by double-clicking in the plot or from Plot->Plot Type Settings->Room Acoustics. An example of plotting reverberation time in octave bands for three different responses is shown below.