Save Data in Active Plot As...
Saves the curves in the plot as columns in a .txt-file.
All curves belonging to a measurement in the plot are saved as columns using tab as separator. A one-line header contains the title of the columns. The first column of the header is named x-axis, the next column(s) are given the name of the series title (maximum 30 characters). The character Tab is used as column separators in the header also.
If the x-axis is not the same for all curves in the plot, a x-axis is constructed that contains all the x-axis values for all the curves. This is the case e.g. if the sampling frequency is not the same, e.g. if a value is missing e.g. when plotting reverberation time and the signal-to-noise ratio si not good enough to compute a value. If a y-value does not exsist at a certain x-value, the text NaN is written to indicate that it is not a number.
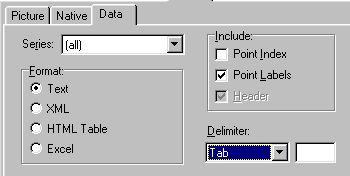
Note that an alternative method that gives access to advanced settings is found in Plot->Chart Settings for Active Plot..., click the Export tab, then click the Data tab. The dialog box will then show the settings below.
These writing procedures are slow if data with more than 10000 poins are to be saved. Therefore, if you want to save the time data (impulse response) we recommend that you use the File->Save Active Measurement As... procedure and use the .wmt format. That will save the time data as a text file with a short header.
If you have problems exporting the data to a spreadsheet, e.g Excel, see the FAQ: Room Acoustics section for more information.