
Standard Toolbar
The standard toolbar contains the most frequently used buttons.
 File->New
 File->Insert
 File->Open
 File->Save Active Measurement As
 File->Print
 File->Print Preview
 Edit->Copy to Clipboard
 Measurement->Start Measurement
 Measurement->Cancel Measurement
 View->Volume and Input Level(s) Dialog
 Plot->Hold Plotted Curves
 Plot->Solo Active Measurement Curve
 Plot->Auto Refresh
Determines if auto refresh is turned on or off. If it is turned on, it can be in two modes as seen from the Plot->Auto Refresh sub-menu. Either Active Measurement or All Measurements.
 Plot->Refresh All
 Plot->Add Curve(s)
 Plot->Delete All Curves
 Plot->Chart Settings for Active Plot...
 Add legend to active plot. This and other legend settings are found in Plot->Chart Settings for Active Plot..., select the Legend tab.
 Add gridlines to active plot. This and other gridlines settings are found in Plot->Chart Settings for Active Plot..., select the Axis tab, then select the Ticks tab, or the Minor tab for the minor gridlines.
 Display title to active plot. This and other title settings are found in Plot->Chart Settings for Active Plot..., select the Titles tab.
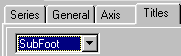
 Display footer to active plot. This and other comment settings are found in Plot->Chart Settings for Active Plot..., select the Titles tab. Then select SubFoot as shown in the figure below.
 Display axis title to active plot. This and other axis title settings are found in Plot->Chart Settings for Active Plot..., select the Title tab.