Various
These settings apply to all plot types.
If  is checked, a message box is displayed when closing the active window asking if the plot is to be saved.
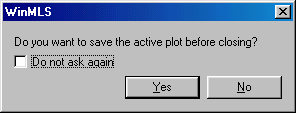
If Yes is chosen, the browser for saving the active plot as picture format is displayed (same as File->Save Active Plot As ).
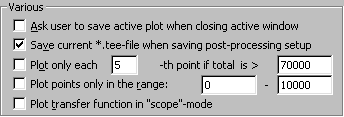
If  is checked, the chart-file is saved when the post-processing setup is saved. Also when the temporary post-processing setup is saved, a temporary Chart-file is saved. A Chart-file contains all the settings in the Plot->Chart Settings for Active Plot... dialog box except for the settings of the plotted curves.
Note that when it is unchecked, the curves in the plot are not deleted automatically. This means that when a new Group window is opened or when the software is run, the previous curves are not deleted.
By checking  only every nth point will be plotted if the total length of the data is below as certain limit. This may be useful to make the plotting faster if a large file is to be plotted, e.g. a large .wav-file.
By checking  , it is possible to plot just a certain range of the data points. This may be useful for plotting a part of a large file.
If  is checked, a transfer function measurement (a MLS measurement) is plotted in scope mode. This means that only the scaling of the input is considered, and not the output scaling.