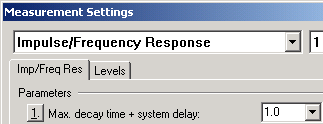
To get a true frequency resolution of 1 Hz, you need 1 second of the signal in the time domain. Set this in Measurement->Settings , an example is shown below where 1. Max decay time + system delay is set to 1.0.
If the sampling frequency is 48000 kHz, this means 48000 samples.
The frequency resolution can also be set as post-processing
in WinMLS using the time data window (true frequency resolution), do this in
Plot->Plot Type Settings->Time
Window
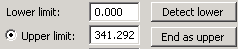
. To get maximum true frequency resolution, set the lower limit as
low as possible and the upper limit as high as possible. This can be done by
clicking the  button as shown
below.
button as shown
below.
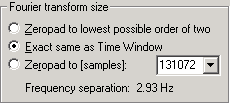
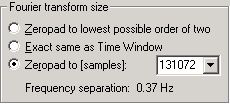
Another way is by setting the length of the FFT larger than
the time window. This is done from Plot->Plot Type Settings->General
Frequency Domain.... Select the  radio button as shown in the rightmost figure below.
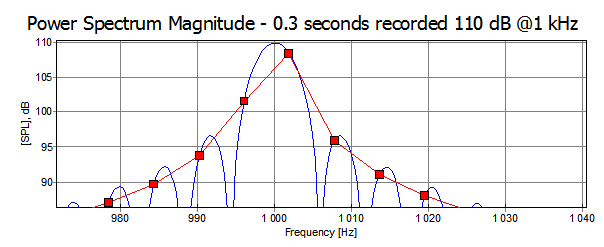
If you see the bottom line of both figures above, you see that the frequency separation changes from 2.93 Hz to 0.37 Hz. Note that the zero-padding does not add any extra information, but it has the same effect as an interpolation in the frequency domain. But this interpolation may be very useful. In the figure below the red curve shows the sinusoidal signal at 1 kHz without zero-padding and the blue curve is when using zero-padding. We see that the blue curve detects the frequency to be 1 kHz, while the red curve does not have enough points to detect this accurately.
 Contents
 Index
Index Search
 Previous
 Next
Next