Go to Setup->Load and load the setup named General_Harmonic Distortion (1 kHz sine) and follow the instructions in the wizard.
Start a measurement from Measurement->Start or if you want to analyze a file that contains a sinusoidal signal use File->Open.
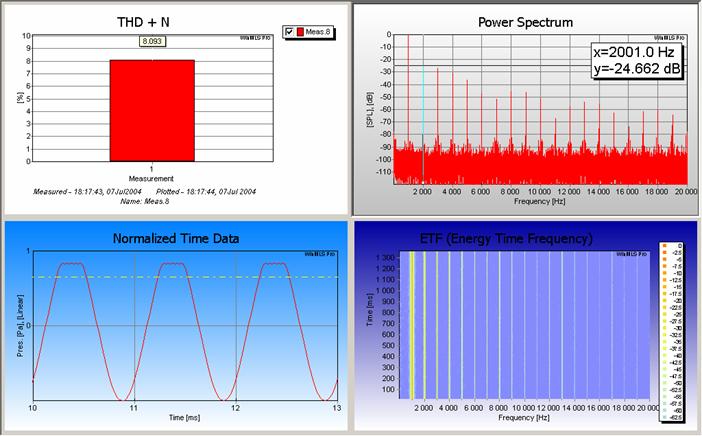
In the setup, four plots are displayed as shown in the figure below.
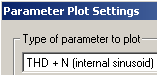
Important: The THD + N plot displays the total harmonic distortion for an external signal as default. If you are using your sound card output to playback the sinusoid signal, then you should change this to internal signal to increase the accuracy. Go to Plot->Plot Type Settings->Parameter and select THD (internal sinusoid) as shown below. But do not use this setting if you do not generate the signal from the sound card.
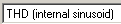
You may also select THD (the noise is not included) as shown in the figure below
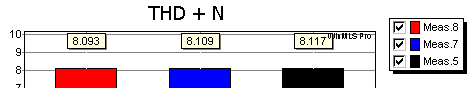
If you wish to compare multiple measurements in the plot, make sure that Plot->Overlay is checked as shown in the figure below.
 Contents
 Index
Index Search
 Previous
 Next
Next