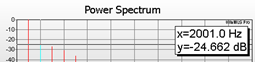
The Power Spectrum plot displays the harmonic distortion components. By moving the mouse cursor above the harmonic you wish to find the value of, the value is displayed in the text box as shown below.
Note: When using the cursor to find the harmonic components position the mouse cursor inside the plot, but as high as possible (as near 0 dB as possible if 0 dB is the highest value). If the cursor is not high above the component, the more accurate the cursor must be positioned to find the highest value.
 Contents
 Index
Index Search
 Previous
 Next
Next