We will now find the sound card
delay in the unit samples. First click in the upper plot window to set it as
active (a small border will appear around the active
plot). Then go to Plot->Plot Type
Settings->Active Plot
or click the  button on the Plot toolbar. This will open the Time Data Settings
dialog box since Time Data is the active plot. To the upper left select
Time [samples] as axis unit for the x-axis:
button on the Plot toolbar. This will open the Time Data Settings
dialog box since Time Data is the active plot. To the upper left select
Time [samples] as axis unit for the x-axis:
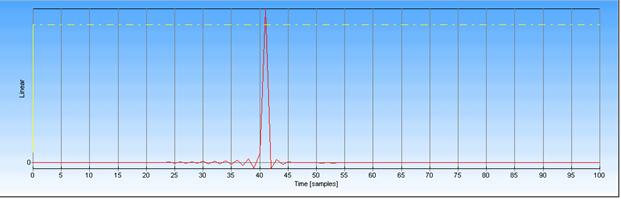
Zoom in on the x-axis of the upper plot. Do this by typing
the number 100 in the edit box  found in the Plot Toolbar (usually it is placed at the
lower left in WinMLS, you can turn it on/off from the View menu). Then
the upper window will display the first 100 time samples of the x-axis as shown
in the figure below.
found in the Plot Toolbar (usually it is placed at the
lower left in WinMLS, you can turn it on/off from the View menu). Then
the upper window will display the first 100 time samples of the x-axis as shown
in the figure below.
From this we see that the sound card has a delay of 41 time samples. It is possible to correct for this delay as explained in the measurement part of the FAQ
Note that you can also use the arrow keys to move the axis limits. This is the fastest way of making changes.
Try this: Hold down the Alt key while holding down the Left and Right arrow keys. This will move the upper axis limit.
Then try this: Hold down the Ctrl key while holding down the Left and Right arrow keys. This will move the lower axis limit.
Finally: Hold down the Shift key while holding down the Left and Right arrow keys. This should auto-scale the lower and upper axis limit.
Note: If you need to set the vertical axis limits, use the same method as above but use the Upper and Lower arrow keys.
Now restore the old x-axis unit Time [ms] from the
Time Data Settings dialog box and restore the maximum axis value by
clicking the  button.
We will now plot the impulse response using dB as the y-axis. To do this, first click in the plot window to make it active, then push the F5 key. This will open the Time Data Settings dialog box. In the upper left select dB as axis unit for the y-axis:
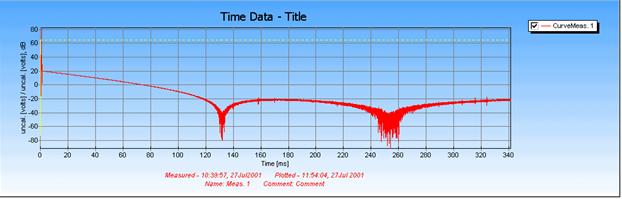
Click OK to exit the dialog. This will update the plot with the new settings. The result should look similar to the figure below.
Figure 2 A Digigram VX222 sound card measured loop-back, plotted using dB as y-axis.
 Contents
 Index
Index Search
 Previous
 Next
Next