If your loop-back sound card
measurement performed above looks suspicious, we recommend that you first
compare it with the other measurements of sound cards. Click  on the standard toolbar or
use File->Open
to open a new measurement as shown in the figure
below.
on the standard toolbar or
use File->Open
to open a new measurement as shown in the figure
below.
Double-click the Soundcards folder shown in the figure above to display the available measurements of sound cards.
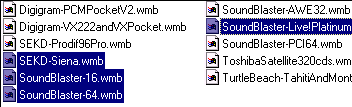
Note that you can select several files by holding the Ctrl key while left- clicking. As shown in the figure below (some of these files may not be found in your installation, but they can be found at our homepage or by contacting us).
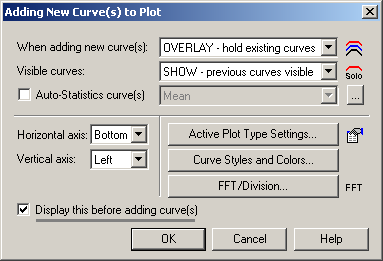
You may now see the dialog shown below. Use this dialog to make changes, e.g., if you want to add new curves on top of the existing curves or to erase the existing curves when adding new curves.
Note: If  shown above is not checked, this dialog will not be
displayed when a new curve is added. When you become more familiar with WinMLS
you may not want to display this dialog, but for a beginner it is useful.
shown above is not checked, this dialog will not be
displayed when a new curve is added. When you become more familiar with WinMLS
you may not want to display this dialog, but for a beginner it is useful.
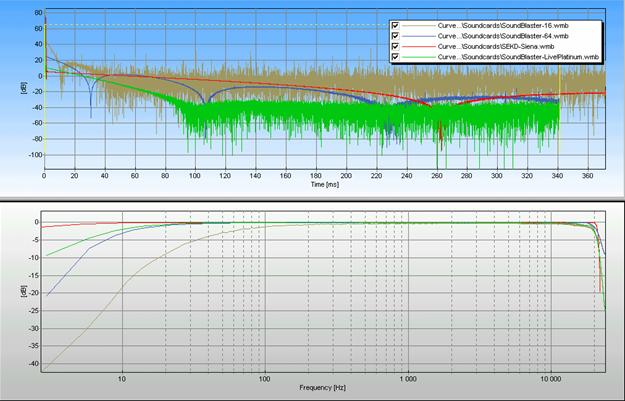
The result will be similar to the figure shown below (some changes to the layout have been done, which will be explained later). From the figure we see the results from the different sound cards. The measurement in brown could probably be improved by optimizing the volume settings, but we see that the frequency response is quite smooth for all the measurements.
Note: In the figure below, the order of the plots are changed, displaying the time data (impulse response) in the upper plot. The order of the plots can be changed from Plot->Plot Type/Routing/Test....
 Contents
 Index
Index Search
 Previous
 Next
Next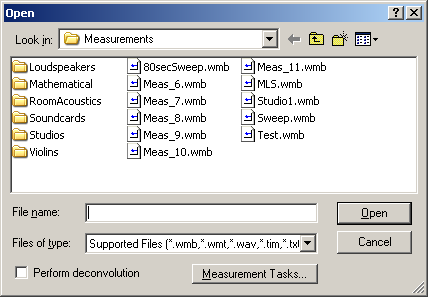
 to open the file(s).