To verify the measurements you may listen to the raw data. To do this, go to Measurement->Listen . This command will play the active measurement in the loudspeaker. If you are not sure that a measurement is correct, you may listen to it after it is performed.
You may also listen to a measurement later, you can select the measurement you want to listen to from the Measurement Selection toolbar shown below.
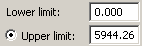
If you find out that a measurement is contaminated by noise, you can choose not to use the measurement or you can select to use a part of the measurement that is not affected by the noise. To select the part you want to include, go to Plot->Plot Type Settings->Time Window . In this dialog box, select the lower and upper limit as shown below.
If you go to Measurement->Listen it will playback the part of the measurement that is within this time window so it is easy to check if you have selected the correct time window.
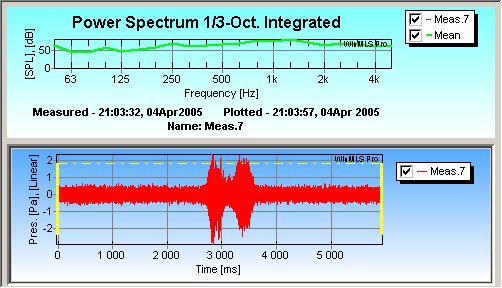
Another way of selecting the time window is to click the  button found at the middle bottom
of WinMLS. This will display one extra plot with the time window as shown in the
figure below
button found at the middle bottom
of WinMLS. This will display one extra plot with the time window as shown in the
figure below
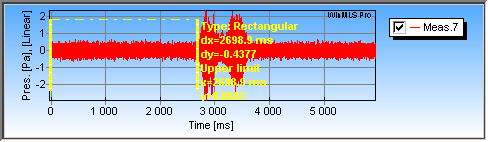
In the lower plot above, we see that the middle part around 3000 milliseconds is affected by noise. To exclude this part, we drag the upper yellow bar right before the affected part as shown in the figure below.
After dragging the window, the level plot will be updated immediately.
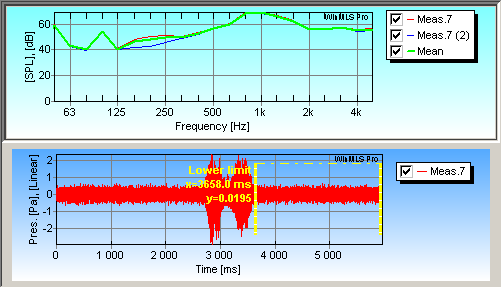
It is also possible to use the last part. To do this, first
click in the upper plot to make it active. Then click on the  button or use Plot->Add
Curve(s)... to add a new curve. In the figure below it is named Meas.7
(2).
button or use Plot->Add
Curve(s)... to add a new curve. In the figure below it is named Meas.7
(2).
Then click in the lower window and use the mouse to drag the time window to the last part of the measurement as shown in the figure below.
 Contents
 Index
Index Search
 Previous
 Next
Next