The results should look something like below.
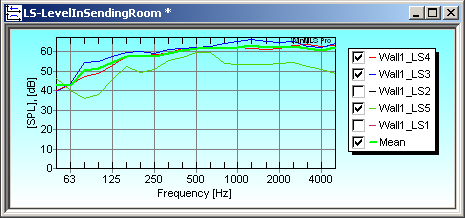
The green thick curve gives the mean value and is used for the computation of the final result. Note that it is automatically updated when a curve is added. If you do not wish to include a curve in calculating the mean, you can uncheck it in the legend (as we have done with Wall1_LS2 and Wall1_LS1 in the figure above).
 Contents
 Index
Index Search
 Previous
 Next
Next