Add text to Plot
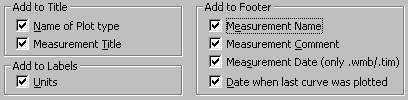
These settings determine if the plot title/footer/labels are to be updated and what is written after a measurement is plotted.
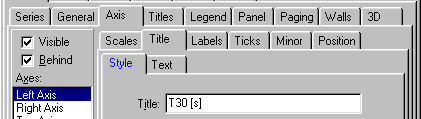
If no check boxes are checked, the text is not changed. This is useful if you want to use your own text. The axis labels is set in Plot->Chart Settings for Active Plot... under the Axis tab, then under the Titles tab as shown in the figure below.
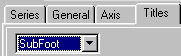
The title is set in Plot->Chart Settings for Active Plot... under the Titles tab. The footer is also set there by selecting  as shown below.