 button. This will open the Time Data Settings dialog box. To the upper left select Time [samples] as axis unit for the x-axis:
Changing plot settings
We will now find the delay in unit samples. First click in the upper plot window to set it as active, then type the F5 key or click the button. This will open the Time Data Settings dialog box. To the upper left select Time [samples] as axis unit for the x-axis:

Zoom in on the x-axis of the upper plot. Do this by typing the number 100 in the edit box to the right of the  button found at the lower left. Then the upper window will display the first 100 samples of the x-axis as seen in the figure below
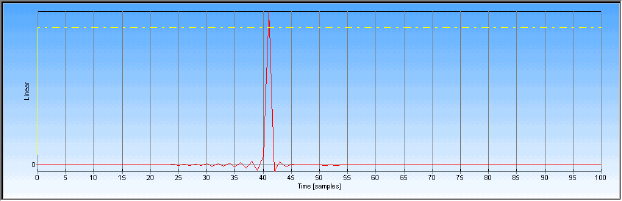
From this we see that the sound card has a delay of 41 samples. It is possible to correct for this delay, how to do this is explained in the measurement part of the FAQ.
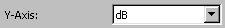
Now restore the old x-axis unit Time [ms] from the Time Data Settings dialog box and restore also the maximum axis value by clicking the  button. We will now plot the impulse response using dB as y-axis. To do this, first click in the plot window, then type the F5 key. This will open the Time Data Settings dialog box. To the upper left select dB as axis unit for the y-axis:
Click OK to exit the dialog box, this will update the plot with the new settings. The result should look similar to the figure below.
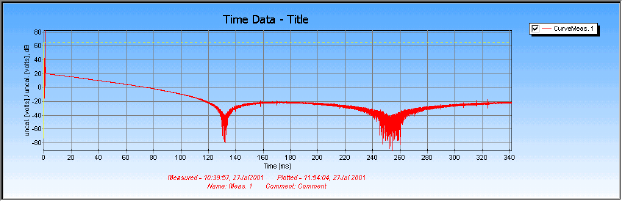
Figure 2 VX222 sound card measured loop-back, plotted using dB as y-axis.