How to add a text box to the plot?
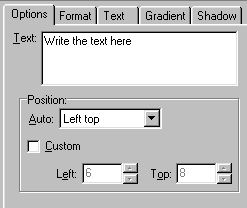
In Plot->Chart Settings for Active Plot..., click on the Tools tag. Then click on the Add button. From the list select Annotation and click on the Add button. A text field as shown in the figure below will be displayed. Type the text in the field, and below the text field the position can be set.