How to find the level difference of two measurements as function of frequency?
Perform or insert the two measurements you want to see the difference between. Select Frequency Response - Spectrum as plot type and one of the measurements as active measurement. This can be done in the Measurement Selection Toolbar or in Plot->Select Plot Type(s) and Active Meas.
The other measurement must then be set as reference measurement. This is most easily done from the Measurement Selection Toolbar also. First make sure the  button is checked, It makes the rightmost list box display the reference measurement if this is taken from memory. (If
  is checked, the list box will not display the reference measurement but the measurement in the lower plot). Select the desired reference measurement from this list box. In the figure below, the measurement Left is the reference measurement and Right is the active measurement.

If the list box is disabled, please do as described below.
Finally perform the division from the Frequency Plots toolbar by clicking the  button.
Setting the reference can also be done from the lower part of Plot->General Frequency Domain Settings... dialog box. The reference measurement part of the dialog box is shown below.
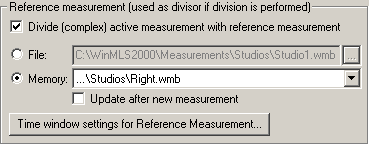
Make sure  is checked. The in the list box below, select the desired divisor measurement (Right is selected in the example above). If you want to window the measurements, click
  . It should be checked that the window settings are equal for the two measurements. When the dialog box is exited with
  you should now see the level difference between the measurements as function of frequency.