How to measure speech transmission indexes STI or RASTI?
STI or RASTI can be measured using WinMLS. The software has previously been tested against MLSSA’s RASTI calculation and recently against the B&K Speech Transmission Meter. The agreement was good.
Currently the sound card must be able to perform a MLS measurement in order to do this. Please check this by going through the procedure described in the section Loop-back measurement of the sound card in the WinMLS2000 Users Guide.
It is also recommended that you read and use the Speech transmission indices section and use that as a reference when reading this. Below the steps for setting up and measuring STI and RASTI is given.
1.
Load measurement settings for room acoustics measurement
Select the measurement setup named Room Acoustics  from the Setups Toolbar (initially situated at the bottom right). It will load the initial settings that we will slightly modify.
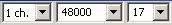
If you are measuring in a reverberant room, having a reverberation time larger than one second, in the Measurement Settings Toolbar (View->Measurement Settings Toolbar), set the sequence order to 17 as shown to the right in the figure below
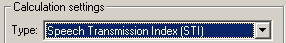
Select RASTI or STI as plot type.
In Plot Toolbar (initially situated at the bottom), select plot type Room Ac. Parameters 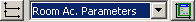 . Click in the plot to make it active and click F5 to access the plot-type settings. Then select RASTI or STI as shown below
Determine if noise compensation is to be used.
Find out if your STI/RASTI measurement has to take the background noise into account. It should be done if the speech-to-noise ratio is less than 15 dB in the octave bands of interest. If no, in the lower right part of Room Acoustics->Parameter Settings... select the correction option.  and skip the next point. If yes, read the next point.
Find background noise level for noise compensation.
There are two options for compensating for the background noise as explained below. These are found in the lower right part of Room Acoustics->Parameter Settings...
The options Correction, fixed noise/speech assumes that the background noise is measured. One advantage is that this method can be used in cases where the background noise is very high (averaging can be used to increase the signal-to-noise ratio). Another advantage is that it is not needed to calibrate the WinMLS input chain. The background noise level can be measured using an octave band level meter. The octave band values can be typed in by first going to the lower left part of the Room Acoustics->Parameter Settings.... The  button opens up a new dialog box where the necessary data can be entered.
The option Correction, noise updated automatically computes the background noise from the measured impulse response with WinMLS. In order to do this, the input chain (including the microphone) must be calibrated. The easiest way of doing this is to use a microphone calibrator with known frequency and level. The calibration is also possible to do without a calibrator. See How to perform absolute calibration of input level? and perform one of the methods of calibration described there.
Please note that this option should not be used on measurements performed using averaging since the averaging will reduce the effect of the background noise. Therefore, in the Measurement Settings Toolbar (View->Measurement Settings Toolbar), set the number of averages to 1 as shown to the right in the figure below

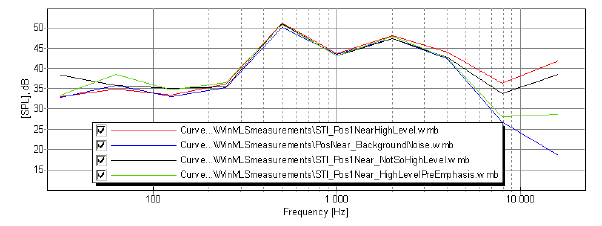
On the same toolbar, make sure that the De-emphasis is turned off as shown:  . This is because the de-emphasis will influence the calculation of the background noise. The Pre-emphasis can be left turned on. It will reduce the treble output and reduce the chance for distortion. Distortion gives spurious peaks in the MLS signal that may artificially increase the calculated background noise for higher frequencies. An example is shown in the figure below where the blue curve is the sampled background noise in octave band, the green curve is the computed background noise from an MLS measurement using pre-emphasis, the red curve is a MLS measurement with high level and the black curve is a MLS measurement with not so high level. From this we can see that using pre-emphasis gives the best estimation of the background noise.
When finished, save the measurement settings using the  button in the Setups toolbar (View->Setups Toolbar).
Perform the measurement
Connect the loudspeaker to the sound card output (left channel) and the microphone to the sound card input (left channel). Place the loudspeaker in the position of the speaker and the microphone in the position of the listener.
Select Measurement->Test Current Levels and set the output level properly. If you are unsure, try measuring with different levels and see what gives the best result.
Click the  button (or Measurement->Start Measurement) to perform the measurement.
If you want measurements to be automatically repeated, in Measurement->Measurement Tasks... make sure  is checked.
Displaying the results
The results will be plotted as bars as shown in the figure below. In this figure the values for several measurements are plotted and the legend moved from its default position in the right corner.
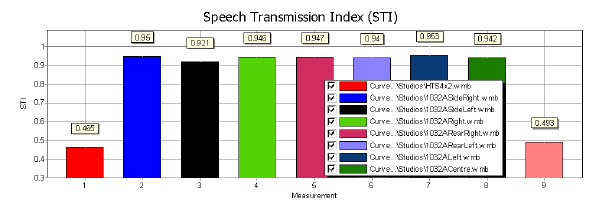
These results can also be saved to a text-file from File->Save Data in Active Plot As.... The data is organized in two columns, the first contains the measurement names, the second the RASTI or STI values.
If you only want to show only one RASTI/STI value in the plot, make sure Plot->Hold Plotted Curves  is not checked when plotting a new curve.