button found at the bottom of the figure below. In the new dialog box, type the desired increment using comma as separator and click OK. If you type 0,2, the Desired Increment will be set to 0,2 as shown in the figure below.
How to set the axis labels increment?
This is useful if you for example want to plot the magnitude frequency response using axis labels with an increment of 5 dB/div for comparing with printouts from other measurement systems.
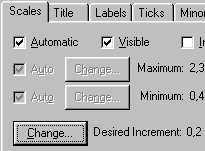
We will show how you can force WinMLS to label the selected axis using a specified increment. From Plot->Chart Settings for Active Plot.... click on the Axis tab. Select the axis you want to modify (Left axis or Bottom Axis) in the left corner of the dialog box. Then click on the Scales tab (see figure below). Click on the button found at the bottom of the figure below. In the new dialog box, type the desired increment using comma as separator and click OK. If you type 0,2, the Desired Increment will be set to 0,2 as shown in the figure below.
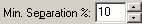
Note that the selected increment will only be displayed if there is enough separation between the labels. This should not be a problem, but by clicking the Labels tab shown in the figure above the separation can be set in percentage: