Performing the measurement
When the levels are set, select Measurement->Start Measurement to start the measurement.
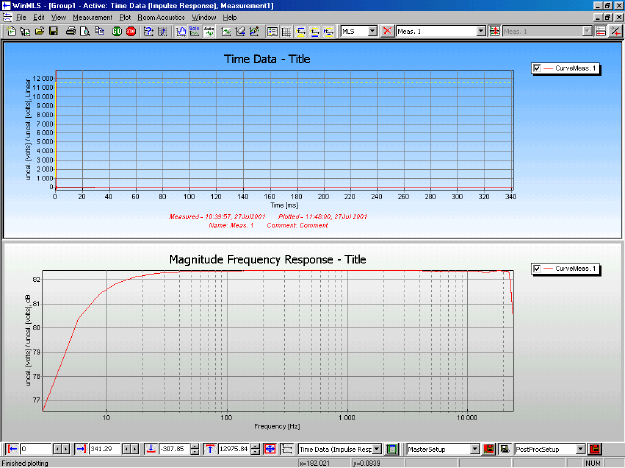
When the measurement is finished, it should look similar to the figure below.
Figure 1 Screenshot after loop-back measuring the Digigram VX222 sound card.
The red curve in the upper plot displays the impulse response of the sound card and the lower plot displays the magnitude frequency response obtained from the impulse response. We see that the impulse response is very short and the frequency response is very flat in the range 20-20000 Hz.