 .
.Selecting curve width and style
The curve width and style is set from .
The choices are listed below.
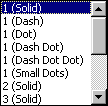
If the curve width is 1, which is the smallest possible, it is possible to plot the line with dashes and/or dots. Note that if the curve contains many data points, the dashes and dots may get so close in the plot that the line looks like it is Solid. But if the plot is saved in a picture format, this should not be the case.
Note that if a curve width greater than 1 is selected, the plotting speed is much decreased.