Smoothing Settings
The smoothing settings dialog is used for all the frequency domain plot-types (magnitude, phase, group delay, waterfall). Each plot type has its own smoothing settings dialog box to keep the smoothing settings independent. The smoothing settings dialog boxes are exactly the same for the plot types, except that the plot type Frequency Response/Spectrum has some extra integration settings added as described below.
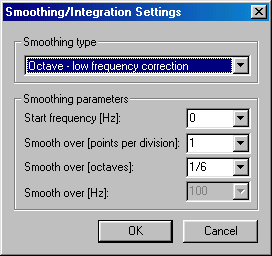
Smoothing calculates the mean of frequency response magnitude values over a sliding frequency band. The band is usually set in octaves (e.g. 1/3 octave wide) to give an equal distribution along a logarithmic frequency axis. A linear band may also be used and may be useful if a linear frequency axis is used to display the data.
Smoothing in power is the standard method of smoothing if it is applied on magnitude frequency response or spectrum. The mean of the squared amplitude values are computed. But you may also smooth to get the mean in magnitude instead of the mean in power, by setting the smoothing type to Octave – magnitude mean/interpolation. Another feature of this setting is the interpolation, that means that it finally interpolates the calculated smoothed values to the frequency points used if no smoothing was applied. Smoothing may increase the calculation time.
If the dialog box is opened from the Frequency Response/Spectrum plot type settings dialog box, integration may be chosen instead of smoothing.
