Default Curve Styles
Displays the dialog box shown below.
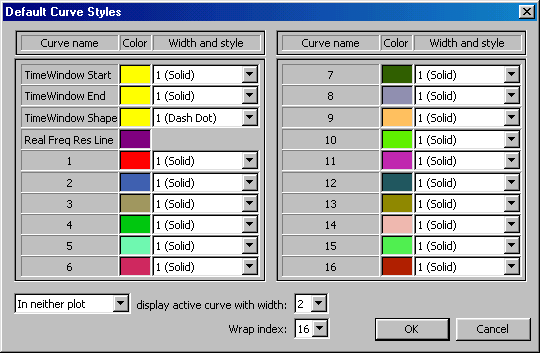
In the upper left of the dialog box shown above, the styles for the time data window and the frequency resolution line is set. After that the styles for curve 1-16 is set. Curve 1 is the first curve plotted, and from the figure above we see that this has a red color. The next has a blue color and so on.
 Selecting curve width and style
Display curve belonging to active measurement with different width