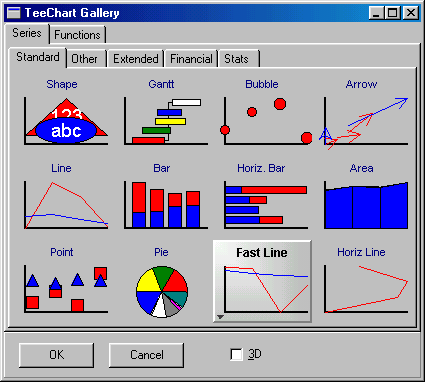
 Select series type, e.g. Fast Line as shown below.
How to make calculations, such as average and difference on plotted curves?
First plot all the curves you want to perform calculation on and go to Plot-> Chart Settings for Active Plot.... In the dialog box, you will see the list of the plotted curves/series. Generate a new curve/series by clicking Select series type, e.g. Fast Line as shown below.
Click on the Functions tag in the upper part of the dialog box. You can select from three tags containing different mathematical functions, Standard, Financial and Extended.
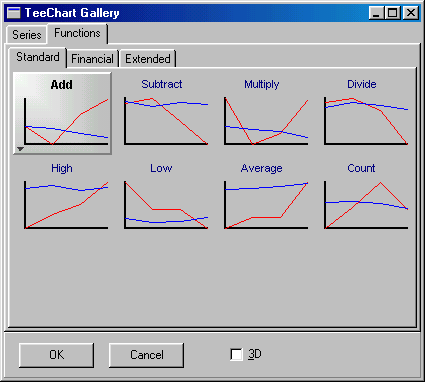
Double-click on the type of mathematical function you want, e.g. Add (see above). You will then go to the series properties (see below).
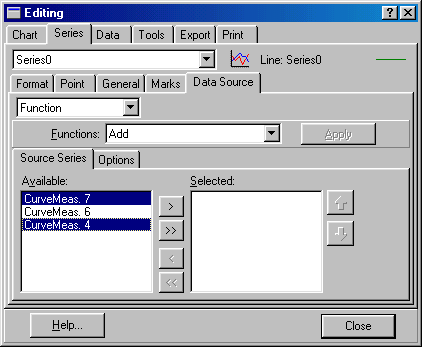
In the Source Series part, mark the series you wish to do the computation on (in the figure above CurveMeas. 7 and CurveMeas. 4 have been marked).
Now use  to move them to the Selected: list. If you want to move all measurements, then use
  .
.
When this is done, click  to exit the dialog box. You will now see the new series in the plot.
You can change the title of the new series by clicking  in Plot->Chart Settings for Active Plot.... How to save the data in the plot to a *.txt-file is also described in this FAQ.