
How to plot a transfer function (e.g. room or loudspeaker measurement) in octave or third-octave bands?
The energy or power can be plotted in octave or third-octave bands if Frequency response/Spectrum is selected as plot type.
Click F5 to display the plot settings dialog box. Make sure that Use Smoothing (or integration) is checked as shown in the figure below. Click on the Settings button also shown in the figure below.
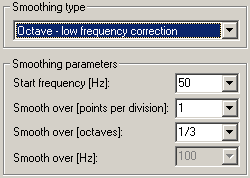
In the new dialog box, select smoothing type as shown below (it will plot 1/3-octaves starting from 50 Hz).
Click OK to exit the dialog boxes.