You can open a measurement file (e.g. with extensions .wav or .wmb) from File->Open.... For the room acoustics parameter(s) to be calculated, the measurement or measurement file must contain an impulse response (measurements that are wrong and contain e.g. background noise only will normally give an error message or completely wrong results).
After a measurement is opened or performed, it will be displayed and look something like that shown below.
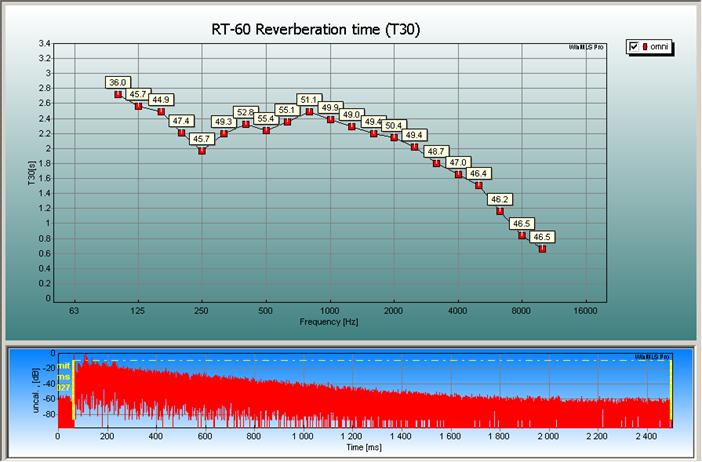
Two plots are displayed, the lower displays the measured impulse response plotted on a logarithmic y-axis that displays the level in dB. From this plot we see that there is a vertical yellow line to the left. This line detects the start of the impulse response which is required for some room acoustical parameters but it is not so critical for calculating the reverberation time.
Note: The upper plot above shows the octave band reverberation time values, the default is one-third octave bands. How to change the bandwidth will be explained later.
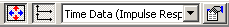
If you do not want to display the lower plot it can easily be
removed from WinMLS. To do this click the  button on the Plot Toolbar
found in the bottom of the screen in the figure above (also see the figure
below).
button on the Plot Toolbar
found in the bottom of the screen in the figure above (also see the figure
below).
The upper plot displays the reverberation time in
third-octave bands. Please note that the yellow number marks  on each point give an indication
of the measurement quality. This number displays the effective decay range
(edr) and should be greater than 25
to give a reliable result (25 is the lower limit for being able to compute T20 strictly according to the standard). The higher
number usually indicates a better quality. In the example plot above, we see
that we do not get any reverberation time values below 100 Hz. This is because
the edr value is less than 25 and thus the results cannot be trusted and
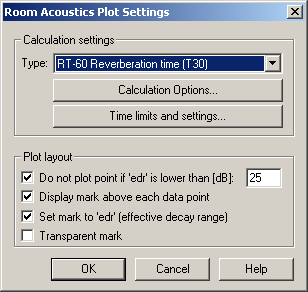
are therefore not plotted. The 25 limit can be changed as we see in the dialog
box shown below.
on each point give an indication
of the measurement quality. This number displays the effective decay range
(edr) and should be greater than 25
to give a reliable result (25 is the lower limit for being able to compute T20 strictly according to the standard). The higher
number usually indicates a better quality. In the example plot above, we see
that we do not get any reverberation time values below 100 Hz. This is because
the edr value is less than 25 and thus the results cannot be trusted and
are therefore not plotted. The 25 limit can be changed as we see in the dialog
box shown below.
To plot the curves without these marks, make sure  is not checked in the dialog box
shown below.
is not checked in the dialog box
shown below.
To open the dialog box shown above, go to Plot->Plot Type Settings->Room Acoustics... (or the
F5 key or click the  button on the Plot Toolbar).
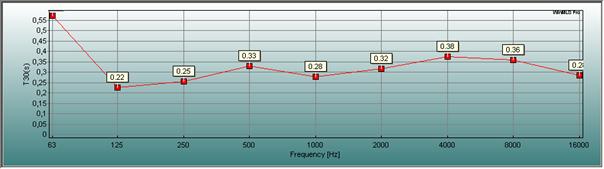
You may set the marks to display the reverb time instead of
the edr as shown in the figure below by unchecking the  check box as shown in the figure
below.
check box as shown in the figure
below.
Note: If you plot the reverberation time as marks in the plot as shown in the figure below (where the data is plotted in octave bands), WinMLS does not do the check on the edr number as explained above.
 Limit the plotting range, e.g. plotting only in the range 100-5000 Hz
Displaying values in octave bands, octave bands, low-mid-high or broadband
Displaying other room acoustical parameters than reverberation time
 Contents
 Index
Index Search
 Previous
 Next
Next