Plot Menu Reference
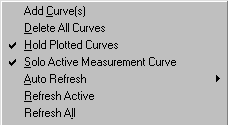
This menu contains all post-processing features, except for the room acoustics. The first part of the menu, as shown below, contains commands and settings for manipulating the plot(s).
The next part allows the user to select which plot type(s) to display and what measurement(s) to plot. It also contains chart settings that apply for the active plot only and settings that are specific for each plot type.
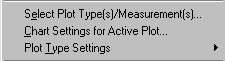
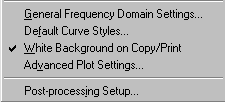
The last part contains various settings that applies to all plots, except for General Frequency Domain Settings... that applies for the frequency domain plot types only.
Each item is explained in detail below.
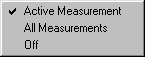
 Menu: Solo Active Measurement Curve
Select Plot Type(s)/Measurement(s)...
Chart Settings for Active Plot...
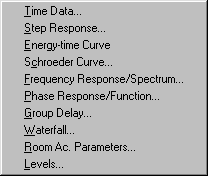
Plot Type Settings: Integrated Time Data (Step Response)...
Plot Type Settings: Energy-time Curve
Plot Type Settings: Schroeder Curve
Plot Type Settings: Frequency Response/Spectrum...
Plot Type Settings: Phase Frequency Response/Function...
Plot Type Settings: Group Delay...
Plot Type Settings: Waterfall...
Plot Type Settings: Room Ac. Parameters...
General Frequency Domain Settings...